UK ash (Fraxinus excelsior) host maps
Before we can investigate the risks faced by ash trees we first need to know where they are found and how many are growing in different regions of the country. This involves a little guesswork, but we are incredibly lucky in Great Britain as lots of information is available to inform our estimates.
Introduction
Ash, Fraxinus excelsior, is a native tree and its range covers the whole country. Ash trees readily self- seed through wind dispersed seeds and are found in many, if not all, land uses. They are most frequent in less managed woodland and hedgerows.
Land use
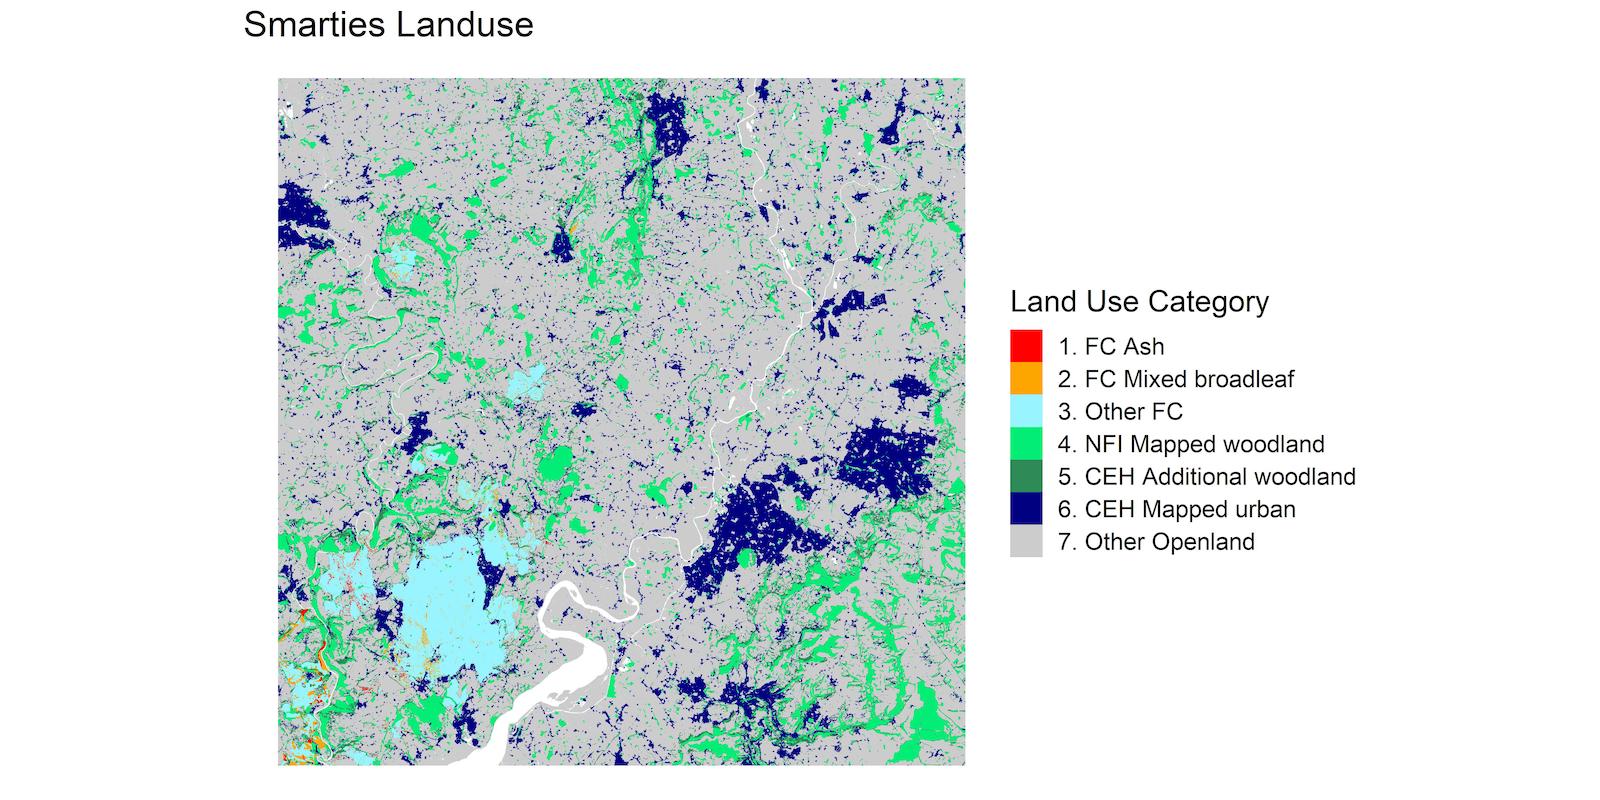
In order to map the ash distribution, we first combined existing land use maps and woodland cover maps to make our own simple seven category map. Each category in our map was chosen so that we could link it to previous published surveys describing tree composition.
- All forestry commission land is included in a database that records all tree species present.
- All woodland > 0.5 ha in size is sampled in the National Forest Inventory
- Smaller woods are included in the countryside survey
- Open grown trees and hedgerows are also recorded in the countryside survey
- iTree surveys have been conducted in a growing number of towns and cities
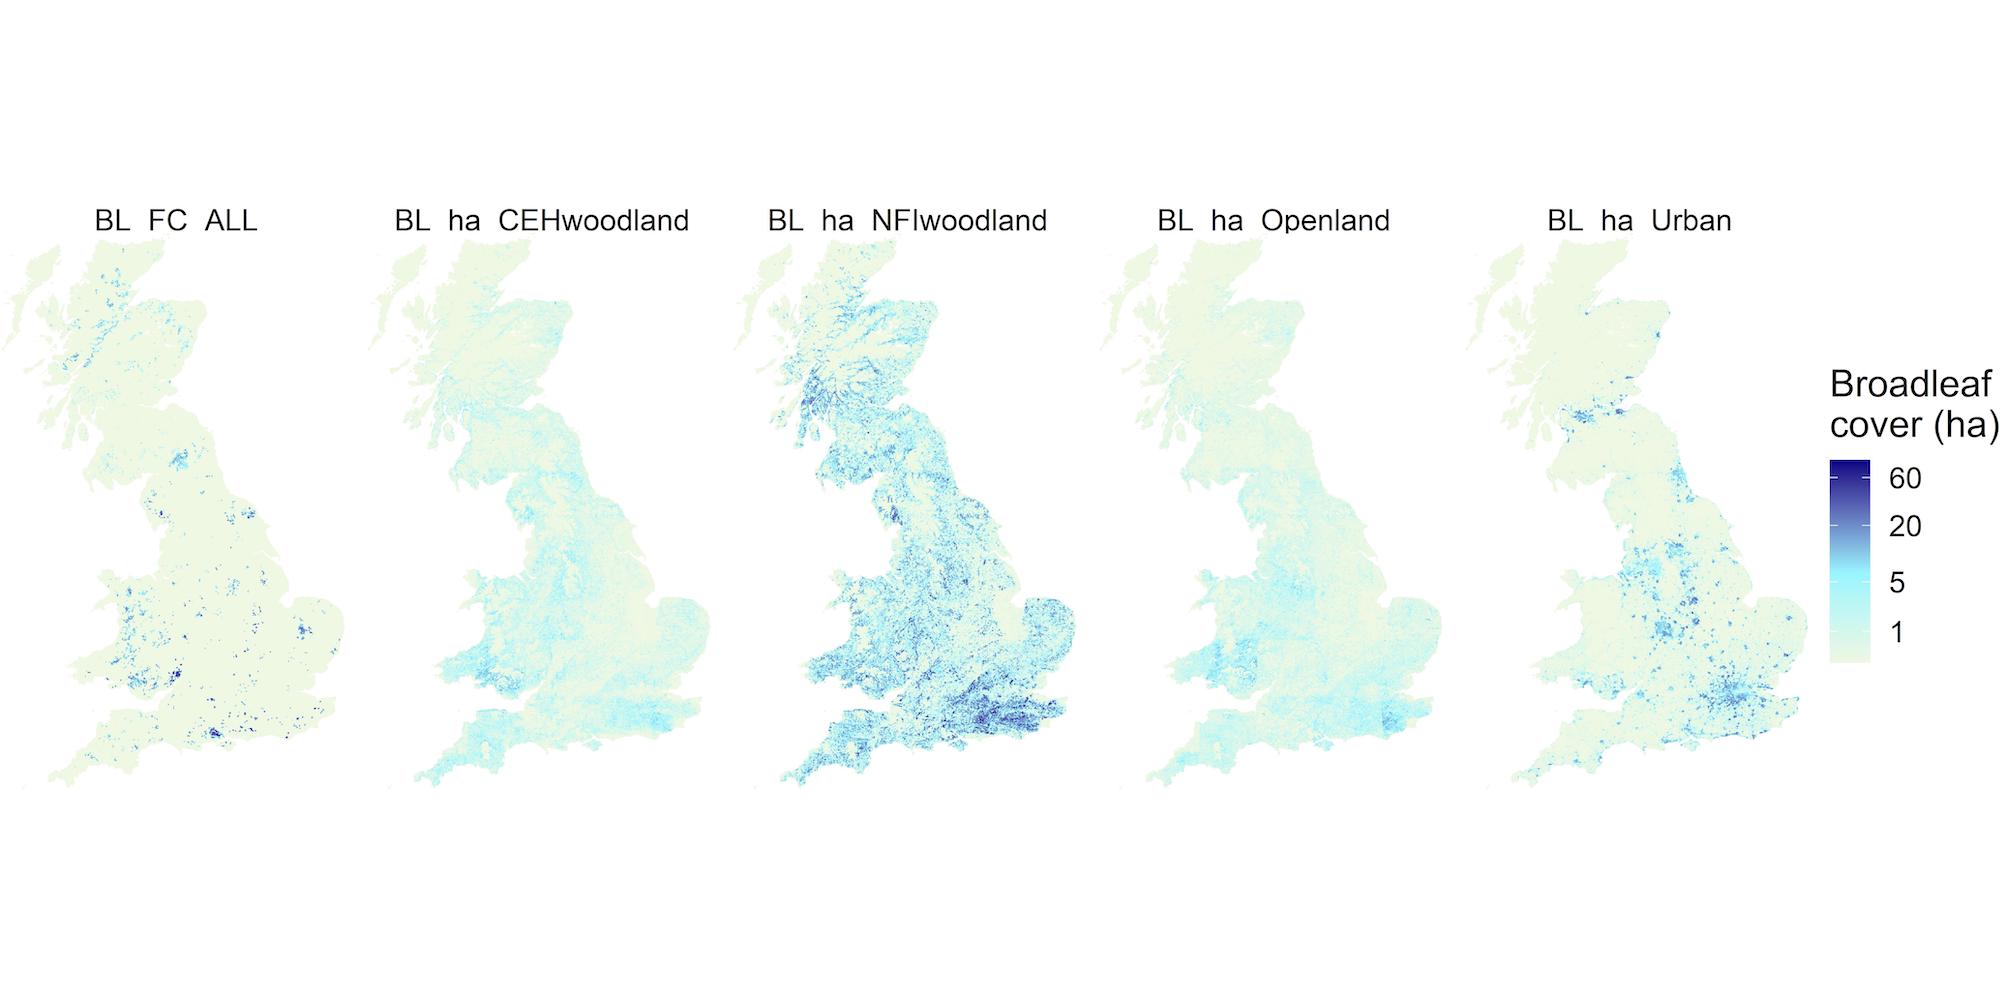
Broadleaf cover
We used Canopy Cover maps produced through Copernicus (a European Earth Observation program) to calculate the amount broad leaf tree cover in each 20m X 20m square of the land class map. We could then summarise the findings to give the total area of broadleaf in each land class across a one- kilometre grid. To add further detail, we repeated this process to include all small woody features (young trees, hedges and scrub).
Ash Abundance
To estimate the amount of ash in each square we combined our broadleaf cover maps with the relevant survey data which described the proportion of ash found within all broadleaved species. The survey data enabled us to map not only the average amount of ash expected, but also generate infinite possible ash maps based on the variation recorded within the survey samples.